The risk of leaving farmer vulnerability undetected: How remote surveys can measure changes in poverty
Most of the world's poor are farmers, who deal with much uncertainty and fluctuating levels of income year-round. Until recently, tools to remotely gather data on levels of poverty have not picked up these seasonal changes, making it hard for funders and policymakers to know how and when to best support them. Now, Lean Data specialist 60 Decibels, which spun out of Acumen last year, may have a solution.
“Most of the poor people of the world are farmers – farmers with very small plots of land, who have to deal with a great deal of uncertainty because they don't know what their yield is going to be, and in many years they are making just enough – or not even enough – to have the food that they expect.” - Bill Gates, May 2013
The importance (and challenge) of understanding farmer poverty levels
Bill Gates is famous for saying that if you’re going to do something about poverty, the most effective way to do it is by improving agricultural productivity and farmers’ income. To do this, one must take a two-pronged approach: help farmers increase their incomes and manage the inherent cyclicality of these incomes.
Most farmers’ incomes follow a seasonal pattern that matches agriculture cycles: they are more cash-constrained and consumption poor before the harvest, and they have their highest cash on hand after the harvest. This is even more pronounced during times of increased climate and economic shocks.
While this pattern is intuitive enough, getting an accurate measure of the size of these swings is harder than it appears. Measuring poverty is a notoriously tricky and often time-intensive task. Doing so at regular intervals and with enough sensitivity to pick up seasonal changes is even harder.
Measuring poverty is notoriously tricky... doing so at regular intervals and with enough sensitivity to pick up seasonal changes is even harder
Our team at 60 Decibels set out to tackle this problem by developing and testing a new poverty measurement tool in Kenya. Our pilot revealed stark differences between pre- and post-harvest poverty levels for the Kenyan farmers we spoke to: we found that twice as many households were living in poverty before the harvest compared to after.
These results have implications both for how we measure farmer poverty levels and how we support farmers to minimise these variances throughout the year. They also give us insights into how to think about faster, more sensitive forms of data-gathering during the current Covid-19 crisis, which is severely threatening farmer incomes and food security.
Remote data gathering and the limits of poverty assessment tools
At 60 Decibels, a tech-enabled social impact measurement and customer intelligence company, we’ve been tackling the poverty measurement challenge as a core part of our work for the last six years. The primary tool we use to measure poverty levels is Innovations for Poverty Action’s Poverty Probability Index (PPI). This simple, 10-question survey that takes less than five minutes to execute asks a series of objective questions and produces a probabilistic estimate of the poverty levels of respondents. We’ve been pioneers in the remote deployment of the PPI globally, and we likely have the largest global data set of PPI responses collected by phone surveys: well over 100,000 responses from customers and beneficiaries in 30+ countries.
While the PPI has significantly simplified poverty measurement, it is not designed to pick up seasonal changes in incomes. The PPI primarily asks questions about a respondent’s possessions and home (e.g. if they own an iron, what their roof is made of) and about demographic characteristics (e.g. where they live, how many people are in their family) to determine the probability of their household living in poverty.
The PPI is not designed to pick up seasonal changes in incomes... donors, funders and policy makers are unable to design and adapt solutions to help farmers manage this challenging cyclicality
Because most farmers’ responses to PPI questions don’t change from before and after the harvest, seasonal poverty goes largely undetected. Without reliable data on the magnitude of this pattern, donors, funders and policy makers are unable to design and adapt solutions to help farmers manage this challenging cyclicality. As external shocks leave farmers increasingly vulnerable to factors outside of their control (Covid-19, climate change, etc.), the ability to detect changes in poverty levels becomes even more important.
Developing and testing the consumption PPI
To address this issue, last year, we piloted a remote survey tool to see if we could accurately measure changes in seasonal poverty. We worked with the PPI team at Innovations for Poverty Action to develop the Consumption Poverty Probability Index (PPI).
The consumption PPI includes questions about the household’s consumption of essential food items (e.g. bread, meat, milk) in the last seven days. Consumption is linked closely to disposable income, which varies depending on the time of the year. These questions collectively provide an assessment of how likely a household is to be living in poverty at a given time. Collecting this information at different moments in time can help assess changes in poverty.
We demonstrated the potential of this tool through a pilot that involved using it with the same group of potato farmers in Kenya before and after their harvest, to measure the extent to which seasonality affects poverty. We collected data in two rounds: first in August 2018, when farmers were preparing their land and potato crop ahead of the rainy season, and again in March 2019 after farmers had harvested and sold almost all of their potato crop. Each round of data collection took less than four weeks and we heard from over 275 farmers through phone call surveys only.
Each round of data collection took less than four weeks and we heard from over 275 farmers through phone call surveys only
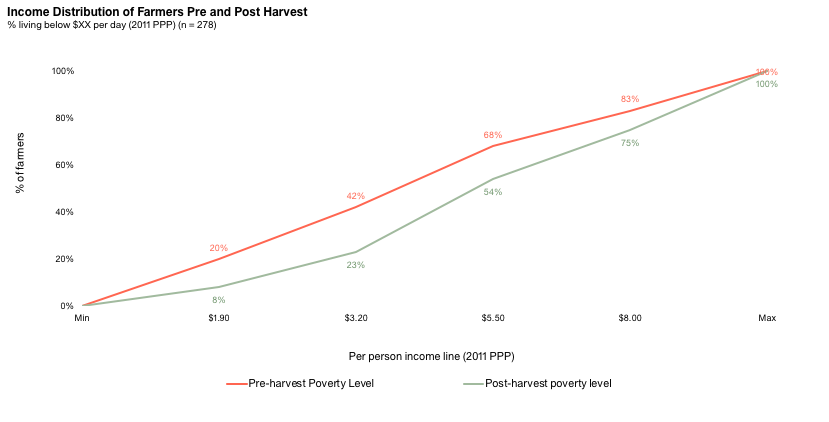
We expected to see an increase in household consumption and a decrease in poverty levels after the farmers were able to sell their crops and had more disposable income at hand, but we didn’t know if these changes would be big or small. The results were striking: the proportion of farmers living in poverty was cut in half after the harvest. During the resource-constrained, pre-harvest season, 42% of farmer households were consumption poor and living below the poverty line of US $3.20 per person per day. After the harvest, this figure fell to 23%. Stating the obvious, this means that poverty levels, using the consumption definition, fell tremendously.

Several agricultural interventions such as crop insurance, inputs (e.g. seeds or fertiliser) available to buy on credit, and long-term leases for tractors are designed to support farmers during these lean periods and in the face of devastating shocks such as the current locust outbreak. Assessing and comparing the success of different interventions is critical to helping private and public sector actors contribute to solutions. Moving forward, being able to predict which times of the year will be worst for farmers will also help make these products and services available at the right time.
Conclusion: Use of the PPI consumption tool and some Covid-19 reflections
The current global context is having unprecedented effects on global agricultural output, food security, and agricultural supply chains. This leaves farmers even more vulnerable to fluctuating and unpredictable incomes.
The ability to quickly and easily track changes in disposable income and poverty levels can be particularly useful now to help decision-makers understand changes in household poverty levels and (hopefully) improvements over time. Especially in countries and among populations where “stocking up” on certain items may not be an option, we would expect to see short-term decreases in consumption patterns. By assessing these changes over time, decision-makers could have rapid and reliable data to understand if vulnerable populations are recovering from this massive shock or if relief and rebuilding efforts have failed to reach those who most need support.
We are in conversation with several partners to use the Consumption PPI tool, alongside a wider set of questions we have developed, to understand the impact of the pandemic on low-income households and livelihoods around the world. We’ve already started adding Covid-related questions to active data collection projects and sharing the results in a public dashboard.
Although everyone will be affected by the ripple effects of the coronavirus pandemic, the negative financial and health impacts will be disproportionately felt by those already marginalised and vulnerable. Centring their voices and investing in long-term listening over the course of recovery is essential insight for developing informed and responsive solutions.
- Venu Aggarwal is Associate Director at Acumen; Ashley Speyer is manager at 60 Decibels, which spun out of Acumen as a separate social enterprise in 2019.
At Pioneers Post we're working hard to provide the most up-to-date news and resources to help social businesses and impact investors share their experiences, celebrate their achievements and get through the Covid-19 crisis. But we need your support to continue. As a social enterprise ourselves, Pioneers Post relies on paid subscriptions and partnerships to sustain our purpose-led journalism – so if you think it's worth having an independent, mission-driven, specialist media platform for the impact movement – in good times and in bad – please click here to subscribe.
Header image from Mount Kenya region, where the 'Two Degrees Up' project looked at the impact of climate change on agriculture (credit: ©2010CIAT/NeilPalmer).


